JCB find the YieldReport to be an invaluable summary of all debt market activity. Whilst we are focussed on the highest grade bonds it is important to see what is..Angus Coote, Executive Director, JCB Active Bond Fund
Interest Rate & Market Commentary for Week Ending 3rd October 2025
Weekly Overview
Global equity markets exhibited heightened volatility, with mixed outcomes across regions and sectors. The S&P 500 declined by 0.31%, weighed down primarily by underperformance in Communication Services and Consumer sectors. However, the Philadelphia Semiconductor Index (SOX) advanced 1.17%, signalling continued strength in technology-related stocks and the enduring momentum in AI and chip demand. This divergence highlights how markets are selectively rewarding sectors with robust earnings visibility while penalizing cyclical and consumer-sensitive industries.
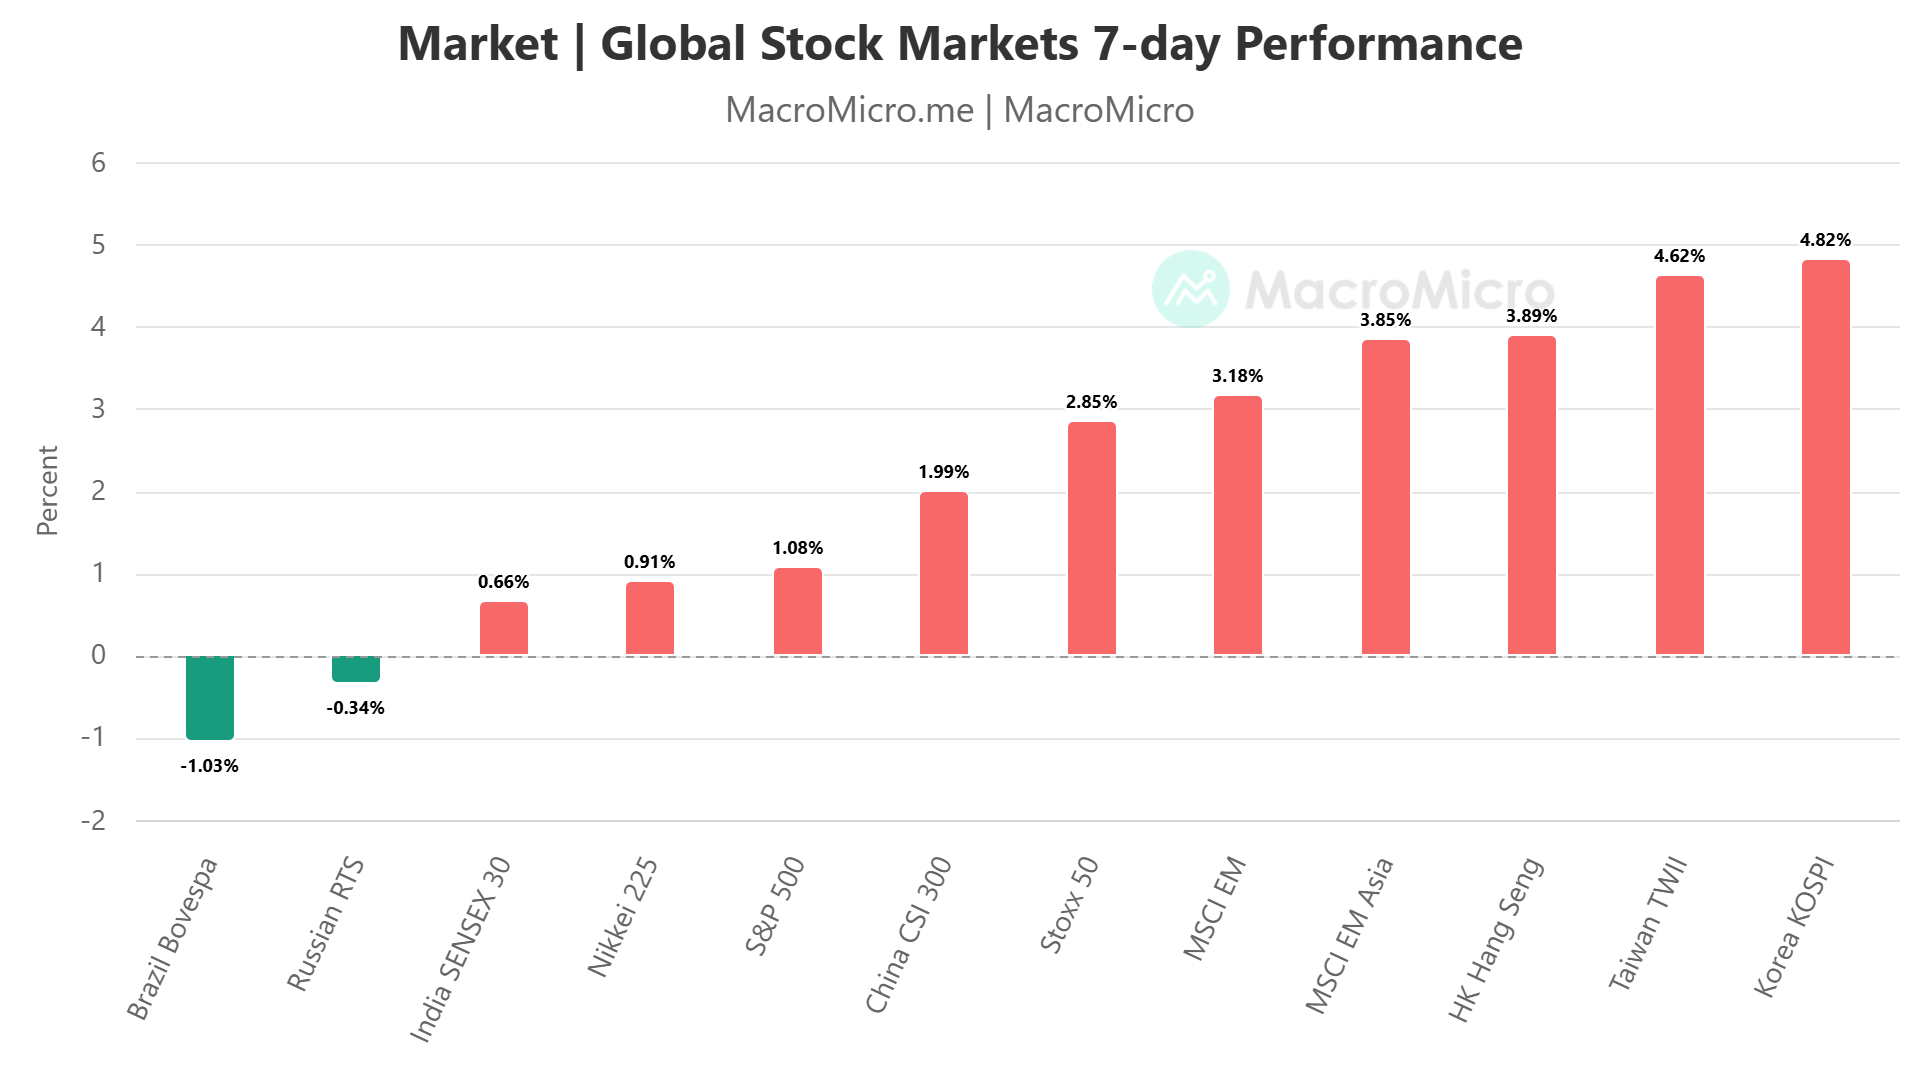
Outside the U.S., international markets painted a fragmented picture. South Korea’s equity market fell sharply by 3.44% from recent highs, reflecting profit-taking in semiconductor and tech exporters following strong gains earlier in the year. Japan’s markets remained stable, supported by steady domestic sentiment and corporate reforms. In contrast, European indices posted modest declines as capital rotated toward defensive assets amid subdued growth expectations. The combination of sectoral and regional dispersion underscores how investor positioning remains cautious, with limited conviction about the direction of global growth or monetary policy.
In the fixed income and commodities space, the U.S. Dollar Index strengthened to 98, reflecting renewed confidence in U.S. assets as global risk sentiment turned mixed. The stronger dollar weighed on non-U.S. equities and commodities priced in USD. WTI crude oil rose above US$65 per barrel, signalling some rebound from recent lows, yet the report notes this remains historically low given global supply dynamics. The U.S. 10-year Treasury yield edged higher, indicating mild upward pressure on bond yields as investors balanced safe-haven demand with expectations of prolonged Fed policy restraint.
Meanwhile, gold prices surged beyond US$3,800 per ounce, reaffirming the metal’s role as a key safe haven amid policy uncertainty and market volatility. The precious metal’s performance contrasts with weakness in risk assets, suggesting that defensive positioning remains dominant among global investors.
Overall, the report portrays a market environment defined by divergent sectoral trends, regional asymmetry, and cross-asset tension. Tech-related assets and safe-haven commodities continue to outperform, while consumer and cyclical sectors lag. Investors are caught between optimism over AI-driven growth and caution over macro headwinds, leaving volatility elevated and direction uncertain heading into the next policy and data cycle.
Amid a government shutdown, a gauge that tracks expectations of short-term U.S. stock market volatility rose modestly from its recent subdued levels. The CBOE Volatility Index closed on Friday around 16.7, up from a reading of 15.3 at the end of the previous week. Despite that rise, the so-called VIX remained far below its year-to-date closing high of 52.3 reached on April 8.
Growth expectations are high as major U.S. banks prepare to kick off earnings season in mid-October. As of Friday, analysts were expecting companies in the S&P 500 to report third-quarter earnings growth averaging around 8.0%, according to FactSet. Such an outcome would mark the ninth consecutive quarter of year-over-year earnings growth
Global Themes Shaping Markets
The U.S. economy remains resilient, with August PCE inflation data showing results broadly in line with expectations. Core inflation pressures are steady, and energy prices accounted for most of the month’s small upside surprise. This balance keeps the Federal Reserve cautious but not alarmed. Markets have moderated expectations for aggressive rate cuts, now aligning more closely with the Fed’s baseline scenario. Policymakers are maintaining flexibility as they await confirmation of continued labor market softening before committing to further policy moves. The tone underscores the Fed’s challenge in navigating “no risk-free path” between inflation control and supporting employment.
In energy markets, OPEC+ has rapidly reversed its previous production cuts, creating what the report describes as a historic global supply glut. The cartel’s output increases have pushed oil prices below U.S. shale producers’ break-even levels, leading to excessive inventories and post-pandemic highs in global stockpiles. This oversupply threatens upstream investment, which is already collapsing due to low prices. The resulting underinvestment could trigger a severe supply contraction by 2027, potentially restoring market power to OPEC+ and Russia in the long term. The commentary highlights this paradox—today’s abundance sowing the seeds of tomorrow’s scarcity.
The gold market has delivered its strongest performance since 1980, reflecting structural and cyclical tailwinds. Investor inflows, alongside a surge in silver prices, reveal a broad-based defensive positioning across precious metals. Key drivers include global monetary easing, declining real interest rates, and record central bank gold purchases. The report notes that the rally appears fundamentally supported—anchored by macro conditions and official sector accumulation—rather than speculative excess.
The price of Bitcoin rose sharply amid the opening days of the U.S. government shutdown and gold climbed for the seventh consecutive week. As of Friday afternoon, Bitcoin was trading above $122,000, the highest level since a mid-August peak and up about 11% for the week.
Finally, the rare earth sector illustrates the geopolitical tension in global supply chains. China’s dominance remains the defining risk, with 2025 export controls demonstrating its ability to weaponize its near monopoly on refining and magnet production. Western responses, ranging from allied sourcing to technological innovation and recycling, show progress but fail to resolve midstream dependency, where China still commands roughly 90% market share.
A turning point in the global monetary regime
In 2025, gold has delivered an extraordinary performance, rising over 40% year-to-date, its best same-period gain since 1980, surpassing even the 2020 pandemic-era bull market. NYMEX gold futures broke above US$3,700 per ounce, achieving nearly 40 new record highs in the year. The rally has been accompanied by exceptional capital inflows: global gold ETFs saw US$37.7 billion of net inflows in the first nine months of 2025, approaching the record set in 2020. Silver mirrored this strength, climbing to its highest level since 2011, underscoring broad-based investor enthusiasm for precious metals as a defensive asset class. These moves are supported by both improving fundamentals and strong technical conditions, indicating durable rather than speculative momentum.
Monetary policy has provided a powerful cyclical tailwind. The September FOMC meeting delivered a 25-basis-point rate cut, consistent with global easing trends. The global rate-cut ratio reached 68%, a four-year high, while real interest rates dropped to 1.8%, their lowest in a year. These conditions—lower real yields, abundant liquidity, and subdued dollar volatility- create an ideal environment for non-yielding assets like gold. The report emphasises that such a combination of monetary accommodation and disinflationary stability has not been seen since the 2020 pandemic response, reinforcing gold’s role as a monetary hedge.
At the structural level, gold’s demand is being reshaped by a shift in global reserves. Official gold holdings reached $4.1 trillion in the first half of 2025, surpassing foreign U.S. Treasury ownership for the first time since 1996—a milestone in the global de-dollarisation process. Central banks, especially within BRICS nations, have been diversifying away from dollar-denominated debt, adding 450 tonnes of gold in Q3 alone—the fastest pace since 2022. This reflects a strategic response to U.S. fiscal instability and sanction risks, which have undermined confidence in U.S. assets.
Simultaneously, U.S. sovereign debt is projected to exceed 130% of GDP by 2026, driving sustained safe haven flows into gold. The correlation between the U.S. debt-to-GDP ratio and gold prices has reached 0.72 over the past decade, illustrating how fiscal stress, deglobalization, and geopolitical tensions now reinforce gold’s structural demand base. The report notes a $500 billion sell-off in ultra-long Treasuries in September, reflecting capital rotation from government bonds to tangible value stores like gold.
Looking ahead, ETF inflows and central bank purchases will be the key forward indicators for the continuation of the rally. Sustained diversification into gold by both institutional investors and monetary authorities suggests enduring demand. However, risks remain: if inflation proves stickier or central banks pause easing prematurely, rising real yields could temporarily pressure gold prices. Conversely, continued monetary loosening and fiscal expansion would likely extend gold’s bull cycle through 2026.
In summary, evidence points to a turning point in the global monetary regime, where cyclical easing, structural de-dollarization, and fiscal fragility combine to elevate gold from a speculative hedge to a strategic reserve asset. The metal’s performance reflects not only short-term policy dynamics but also deep-seated shifts in how investors and governments perceive safety, value, and financial sovereignty.
Figure 1: World – Major Stock Indices 1 Month Return
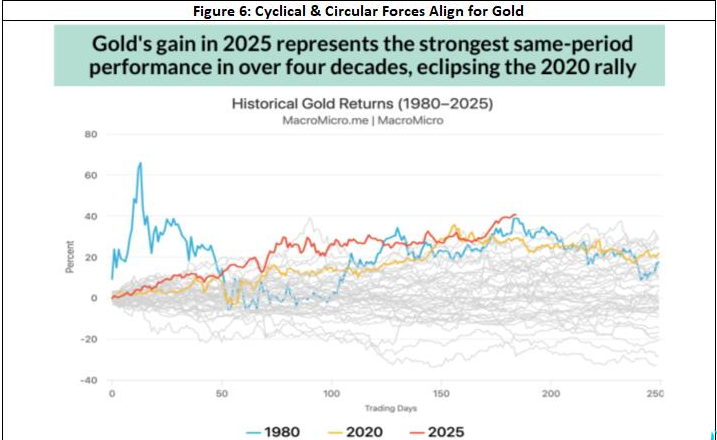
Chart of the week: Cyclical and Secular Forces Align for Gold
In 2025, gold has delivered an extraordinary performance, rising over 40% year-to-date, its best same-period gain since 1980, surpassing even the 2020 pandemic-era bull market. NYMEX gold futures broke above US$3,700 per ounce, achieving nearly 40 new record highs in the year. The rally has been accompanied by exceptional capital inflows: global gold ETFs saw US$37.7 billion of net inflows in the first nine months of 2025, approaching the record set in 2020. Silver mirrored this strength, climbing to its highest level since 2011, underscoring broad-based investor enthusiasm for precious metals as a defensive asset class. These moves are supported by both improving fundamentals and strong technical conditions, indicating durable rather than speculative momentum.
Market Summary Table
Name
Week Close
Week Change
Week High
Week Low
Cash Rate%
3.60%
3m BBSW %
3.60
0.00
3.61
3.57
Aust 3y Bond %*
3.55
-0.05
3.59
3.52
Aust 10y Bond %*
4.32
-0.07
4.39
4.32
Aust 30y Bond %*
5.01
-0.05
5.06
4.99
US 2y Bond %
3.55
-0.11
3.63
3.54
US 10y Bond %
4.09
-0.08
4.15
4.09
US 30y Bond %
4.69
-0.06
4.73
4.69
$1AUD/US¢
66.04
0.76
66.19
65.70
Overview of the US Equities Market
A U.S. government shutdown began on Wednesday after lawmakers failed to reach an agreement to extend funding. Among the functions that ground to a halt were the collection and release of data that investors and U.S. Federal Reserve policymakers rely on to assess the economy. The most prominent report that wasn’t issued was Friday’s monthly jobs data from the Bureau of Labor Statistic
The U.S. stock market closed out the third quarter with another monthly gain in September. The S&P 500 added 3.5% for the month; on a quarterly basis, the index gained 7.8%. As for other major indexes, the NASDAQ outperformed in September, climbing 5.6%, while the Dow added 1.9%.
Despite a turbulent September marked by a US government shutdown, slowing job prospects, and rising debate over central bank independence, global markets defied gravity. Investors embraced momentum trading, fuelling the strongest stretch for trend-following strategies in three years. Gold surged 12%, the yen weakened, and global equities added $35 trillion in market value, as risk appetite remained resilient amid uncertainty.
Momentum dominated across asset classes, driven by abundant liquidity and a dovish Federal Reserve. JPMorgan strategists noted that money supply growth outpaced GDP due to Treasury actions, boosting flows into equities and credit. Exchange-traded funds (ETFs) saw record inflows—US$141 billion in September, the third-highest monthly total ever, with strong demand spanning stocks, bonds, and commodities. The iShares MSCI USA Momentum ETF (MTUM) rose 5% for the month, gaining 23% year to date, while a Goldman Sachs high-beta momentum basket soared 17%.
However, this powerful rally exposed challenges for active fund managers. Only 22% of long-only funds have beaten benchmarks in 2025—potentially the worst performance on record—amid surging tech and AI-related stocks that many active managers underweighted. The S&P 500 gained 3.5% in September and another 1% this week, while the dollar weakened and gold logged its seventh weekly advance.
Market resilience reflects growing faith in a “Fed put,” as investors bet policymakers will prioritize employment over inflation and cushion downside risks. Despite political noise, fears of missing out (FOMO) are overpowering caution. As Northern Trust’s Joseph Tanious observed, investors are unwilling to miss the rally, even as valuations stretch and fundamentals blur. In essence, liquidity, momentum, and optimism—not economic strength—are keeping markets buoyant, making September a defining month for trend-followers and a difficult one for stock-pickers.
Last week ended with tech stocks losing momentum after a record-setting run, as geopolitical tensions and signs of economic weakness weighed on sentiment. The Nasdaq 100 slipped 0.4%, led by a 7.5% drop in Palantir Technologies after reports of flaws in its defence systems, which the company denied. Despite late weakness, the S&P 500 posted a marginal gain, marking its longest winning streak since July and 114 sessions without a 5% correction.
Investors balanced AI-driven optimism with caution amid President Donald Trump’s warning to Hamas over the Gaza conflict and an ongoing US government shutdown, now in its third day. Private-sector indicators showed sluggish hiring and softer demand for labour, while ISM data revealed the services sector stalled in September — the first contraction since the pandemic. With official labour data delayed,
markets are confident the Federal Reserve will cut rates again in October, pushing the dollar to its weakest week since August and 10-year Treasury yields lower by over five basis points.
AI enthusiasm persisted with major deals such as Global Infrastructure Partners’ potential $40 billion acquisition of Aligned Data Centres, Hitachi’s energy collaboration with OpenAI, and Fujitsu’s expanded partnership with Nvidia. This followed OpenAI’s valuation jump to $500 billion, reinforcing bullish sentiment but also prompting warnings that valuations are “overheated” and reminiscent of the late-1990s tech bubble.
Market gauges from Barclays and Bloomberg signalled exuberant sentiment, while analysts cautioned that investors remain too complacent about the shutdown’s duration. In commodities, oil fluctuated near $61 per barrel, gold extended its seven-week rally on central-bank buying, and gold miners outperformed high-flying AI and chip stocks — underscoring investors’ search for stability amid uncertain policy and geopolitical conditions.
Overview of the US Treasuries Market and Other Fixed Income Markets
A U.S. government shutdown began on Wednesday after lawmakers failed to reach an agreement to extend funding. Among the functions that ground to a halt were the collection and release of data that investors and U.S. Federal Reserve policymakers rely on to assess the economy. The most prominent report that wasn’t issued was Friday’s monthly jobs data from the Bureau of Labor Statistic.
The interrupted flow of economic data resulting from the government shutdown left investors turning to alternative, less comprehensive sources of data from private providers. For example, payroll processor ADP on Wednesday estimated that U.S. private sector jobs declined by 32,000 in September, extending a recent run of weak jobs numbers reported by both government and private sources.
The August PCE inflation report showed prices broadly in line with expectations, reinforcing the view that inflationary pressures remain persistent but not accelerating. The headline PCE Price Index rose 2.74% year-on-year, up from 2.60% in July, while Core PCE increased to 2.91% from 2.85%, both matching market forecasts. On a monthly basis, goods prices turned positive (+0.1%) after prior declines, mainly driven by higher energy costs, while services inflation remained steady at 0.3%, indicating that underlying price pressures are contained outside of volatile energy components.
Importantly, consumer spending continues to drive growth, with Real Personal Consumption Expenditure (PCE) rising 2.7% year-on-year in August, up from 2.5%, marking a resilient household sector despite high borrowing costs. This consumption strength is partly attributed to a wealth effect from rising equity markets, especially among higher-income households. The report also cites an upward revision to Q2 GDP to 3.8% annualized (from 3.3%), primarily due to stronger consumer activity. This data underscores how spending remains the primary engine of U.S. growth even as other components of GDP moderate.
In the policy arena, the Federal Reserve’s rate trajectory is increasingly data-dependent, particularly on labour market trends. Following the August release, markets scaled back expectations for aggressive rate cuts. According to the CME FedWatch Tool, the probability of two additional 2025 rate cuts fell below 70%, aligning more closely with the Fed’s dot plot projection, which indicated a median forecast of two cuts for the remainder of the year. Notably, six FOMC members anticipate no further cuts in 2025, reflecting internal caution.
Chair Jerome Powell emphasized the Fed’s delicate balancing act, describing it as having “no risk-free path.” Policymakers are wary of easing too quickly amid still-elevated core inflation but also mindful of rising unemployment. The upcoming September jobs report, expected to show 43,000 new nonfarm payrolls and 4.3% unemployment, is seen as pivotal for the October policy decision.
In summary, the data reveal a U.S. economy still supported by resilient consumption but facing a policy crossroads. Inflation remains above target but stable, prompting the Fed to pause and reassess. Markets now converge toward the Fed’s cautious baseline—limited rate cuts contingent on sustained labor softening without economic deterioration.
Figure 2: US Cash Rate Expectations
Overview of the Australian Equities Market
Australian shares capped their best week in six months, buoyed by ongoing “Goldilocks” market conditions—a mix of steady growth and contained inflation that continues to lift risk appetite. The S&P/ASX 200 rose 36.5 points (0.41%) to 8,982.4, while the All Ordinaries gained 42 points (0.45%) to 9,282.3, bringing the top-200 index up 2.2% for the week.
Pepperstone’s head of research, Chris Weston, noted a prevailing “buy-everything” sentiment across global markets. While expectations for rate cuts have moderated, investors view this as a positive sign of stronger private-sector growth supporting corporate earnings.
Gains were broad-based, with eight of 11 sectors advancing. Information technology and health care led the charge, while financials and materials also posted solid upticks, reinforcing confidence in both cyclical and growth segments.
The rally follows renewed optimism after markets recovered from April’s tariff-driven sell-off, positioning the ASX within reach of record highs. Meanwhile, the Australian dollar eased slightly to US$0.659, down from US$0.6619 a day earlier, though it strengthened against most other major currencies over the week.
The Reserve Bank of Australia (RBA) held the cash rate steady at 3.6% during its October 2025 meeting. Governor Michele Bullock emphasised a cautious but optimistic outlook, citing signs of recovery in consumption and labour markets. Inflation remains within the target band, though pressures from services and housing persist. The RBA refrained from forward guidance, opting for a data-dependent approach. Markets and government commentary have shifted expectations, with fewer anticipating further rate cuts. The next policy decision will be informed by updated CPI data and labour market indicators in November
Market participants have recalibrated expectations, with fewer anticipating further rate cuts. The RBA acknowledged stronger-than-expected inflation data as a key driver of this shift. While the RBA did not directly reference government commentary, economists and markets have adjusted expectations. Earlier forecasts of further rate cuts have been tempered by stronger-than-expected inflation data.
The RBA will reassess conditions in November, incorporating new labour and inflation data. The transition to full monthly CPI reporting will enhance policy responsiveness. The following exhibit 3 offers insight into sector drivers of economic momentum.
The RBA will reassess in November, with new data on labour markets, inflation, and forward-looking indicators. The transition to a full monthly CPI from the ABS will also influence future decisions.
RBA Financial Stability Report
Financial pressures on Australian households have eased notably, with the Reserve Bank of Australia (RBA) reporting that fewer than 1% of mortgage holders are at risk of arrears, the lowest level since 2022. In its October 2025 Financial Stability Review, the RBA attributed this improvement to lower inflation, recent interest rate cuts, and the government’s reformed Stage 3 tax cuts. Debt helpline enquiries have stabilised, and households are both spending more and rebuilding savings buffers.
Mortgage arrears peaked in late 2024 but have since fallen to around 0.7%, returning to pre-pandemic levels. Many households are making extra mortgage payments via offset and redraw accounts, with savings buffers still above long-run averages and high by international standards. The lowest-income quartile of mortgage holders has enough savings to cover 10 months of repayments, while the wealthiest quartile can cover 20 months.
The RBA noted that property prices have risen about 10% since rate hikes began in 2022, leaving fewer than 1% of borrowers in negative equity and strengthening the “wealth effect” that encourages consumer spending. Household expenditure rose 5% year-on-year in August, led by health, hospitality, and leisure spending.
While business insolvencies remain elevated—especially in construction, retail, and hospitality—the RBA said they are broadly consistent with pre-pandemic norms. Risks from non-bank lenders are contained following slower growth in 2025, and overall credit quality remains sound.
The RBA cautioned that tariff-related global trade risks persist but have moderated since April. Overall, it expects financial pressures to keep easing, with lower interest rates and stronger household balance sheets supporting continued economic resilience and a gradual recovery in consumer and business confidence.
The Australian Bond spreads (3 & 10 years) continue to indicate a positive sloping yield curve with significant steepening in the curve occurring from July 2023 (phase 1) and then accelerating from July 2024. The current spread continues to be at cyclical highs, although lower than record highs observed in 2021. From an investment perspective, steepening yield curves and a rebounding lending environment are likely to boost the domestic economic environment and bank profitability. In a similar vein, the spread between the US 2-year bonds and US 10 Year bond has also been steepening since July 2023.
Looking Ahead: Major Economic Releases for the Week Ending 3rd October
For the week ending October 3, 2025, Australian economic data will be in the spotlight, with Building Approvals and Building Approval Total YY expected to show a rebound from the prior decline, suggesting potential stabilisation in the housing sector amid ongoing rate pressures. The RBA Cash Rate is anticipated to remain unchanged, reflecting a steady monetary policy stance. S&P Global Manufacturing, Services, and Composite PMI Finals may indicate continued expansion in activity, while trade data, including Balance on Goods, Goods/Services Imports, and Export,s could point to a robust surplus driven by export growth offsetting import softness. These releases could signal resilient external sector performance, potentially reinforcing the Reserve Bank of Australia’s dovish outlook for gradual easing to support domestic demand if inflation moderates further.
In the United States, Consumer Confidence is expected to edge lower, highlighting cautious sentiment amid economic uncertainties. S&P Global and ISM Manufacturing PMI Finals may reflect marginal improvement but ongoing contraction in the sector, with Factory Orders anticipated to rebound modestly from the prior drop. Initial Jobless Claims are projected to rise slightly, signalling minor labour market softening, while Non-Farm Payrolls could show subdued job gains, with the Unemployment Rate holding steady and Average Earnings easing. S&P Global Composite and Services PMI Finals are likely to confirm expansion in services. These indicators may underscore a cooling economy with persistent labour resilience, prompting the Federal Reserve to maintain a dovish bias toward potential rate cuts, though global trade uncertainties, including U.S. tariff policies, may continue to pose risks to both economies.
Major Economic Releases for the Week Ending 10 October