
Interest Rate & Market Commentary for Week Ending 28th November 2025
Weekly Overview
Global markets staged one of the broadest and strongest cross-asset rallies of 2025 last week, overcoming earlier volatility, fears of an AI-driven valuation bubble, and even a rare CME outage that temporarily halted futures trading. Investors poured back into risk assets on growing conviction that the Federal Reserve will cut rates in December, reinforced by softer labour-market indicators and rising expectations of a more dovish leadership at the Fed.
After a turbulent stretch marked by anxiety around speculative excess, especially in AI-linked technology stocks, virtually every major asset class rebounded. U.S. equities surged, with the S&P 500 jumping 3.7% in its best week in six months. Alphabet led Big Tech with a 7% weekly gain, helped by the high-profile release of its latest AI model, which revived confidence in the sector’s innovation cycle and eased concerns of an overheating AI bubble. The rally punished bearish bets: leveraged inverse ETFs tied to the S&P 500 have now fallen more than 80% this year.
Treasuries rallied as traders priced in deeper and earlier rate cuts. The two-year yield fell to 3.5%, while demand strengthened across government and credit markets. Junk bonds also rebounded, with the iShares iBoxx High Yield ETF up nearly 1% for the week. Risk appetite returned even to the market’s most speculative corners: volatility dropped across meme stocks, junk credit, crypto and derivatives markets.
Bitcoin climbed more than 7% from its mid-November lows to trade above US$90,000, reversing part of its earlier 30% slide. Commodities rallied broadly: gold and silver surged as lower-rate expectations boosted precious metals, with silver hitting a record on tightening Chinese inventories. The Bloomberg Commodity Index gained over 2% for the week.
Crucially, the momentum persisted despite a major disruption: a cooling-system failure forced the CME to halt trading across key futures and options tied to equities, interest rates, gold, oil and agricultural products. Although the outage lasted longer than the 2019 incident, the market barely flinched, with liquidity shifting to alternative venues and spot markets. The episode underscored both the fragility of market infrastructure and the overwhelming dominance of macro sentiment, specifically, expectations of Fed easing.
The optimism stems partly from shifting political dynamics. Kevin Hassett, the White House National Economic Council director, has emerged as a frontrunner to become the next Fed chair in May 2026, raising expectations of a more dovish pivot. Fed Governor Stephen Miran reiterated that the U.S. economy likely needs substantial rate cuts, reinforcing market conviction. Weakness in labour-market data added weight to this view, strengthening bets that the Fed will cut by 25 basis points in December.
Flows continue to reflect unabated enthusiasm for U.S. assets. The Vanguard S&P 500 ETF is on track for another record year, attracting US$125 billion in 2025 and rising 17% year-to-date. Treasuries have returned nearly 7%, their best performance since 2020, while most-shorted stocks have jumped 28%, making bearish positioning painful.
International markets were relatively stable. Europe’s Stoxx 600 ticked up less than 0.3%, notching a fifth straight monthly gain, while Japan’s Nikkei 225 rose marginally. Hong Kong’s Hang Seng Index slipped by a similar amount, and major Asian benchmarks ended the month lower. Rate-cut expectations were a central market driver. Signs of cooling in the U.S. labour market and messaging from Fed officials increased traders’ confidence that Chair Jerome Powell could push through a December cut. Fed funds futures reflected an 87% implied probability of easing. Strategists noted that beyond the mechanical impact of a 25 bp cut, the signal of policy support may matter more for market psychology.
Commodities rallied sharply, led by silver, which surged above US$56/oz to a record high due to tightening Chinese inventories and rate-cut optimism. Silver has nearly doubled this year. Gold futures also rose to their highest level in over a month. Treasury yields drifted mildly higher but remained near their lowest levels since October, while the U.S. dollar was steady after earlier weakness. Bitcoin briefly topped US$92,000 before moderating but remains well below its October highs.
Australia’s inflation unexpectedly accelerated in October, rising 3.8% annually, with underlying inflation at 3.3%, both above Reserve Bank of Australia (RBA) forecasts. The spike, driven by surging electricity prices (+37%), housing costs (+5.9%) and higher food and recreation expenses, has sharply shifted market expectations: rate cuts in 2026 are now seen as unlikely, with several economists predicting rate hikes instead.
Treasurer Jim Chalmers acknowledged inflation remains stubborn but argued it is still lower than what Labor inherited. Shadow treasurer Ted O’Brien blamed rising prices on excessive federal spending, dubbing it “Jim-flation.” Economists, however, say the data marks a concerning trend, particularly given the expiry of earlier energy subsidies. EY’s Cherelle Murphy said a December rate cut is now implausible and that the RBA may even consider raising the 3.6% cash rate given the long gap before its February meeting. Barrenjoey now expects hikes in May and August 2026, while UBS forecasts two rate rises by the end of 2027. Deloitte’s Stephen Smith warned that the RBA faces a “central banker’s nightmare,” with inflation rising even as economic growth slows.
The launch of the ABS’s new full monthly inflation series, more volatile but timelier, has prompted bond markets to reprice sharply, with traders now assigning a 28% probability of a rate hike in late 2026, compared with expectations of a cut just days earlier.
Figure 1: World – Major Stock Indices 7 Day Return
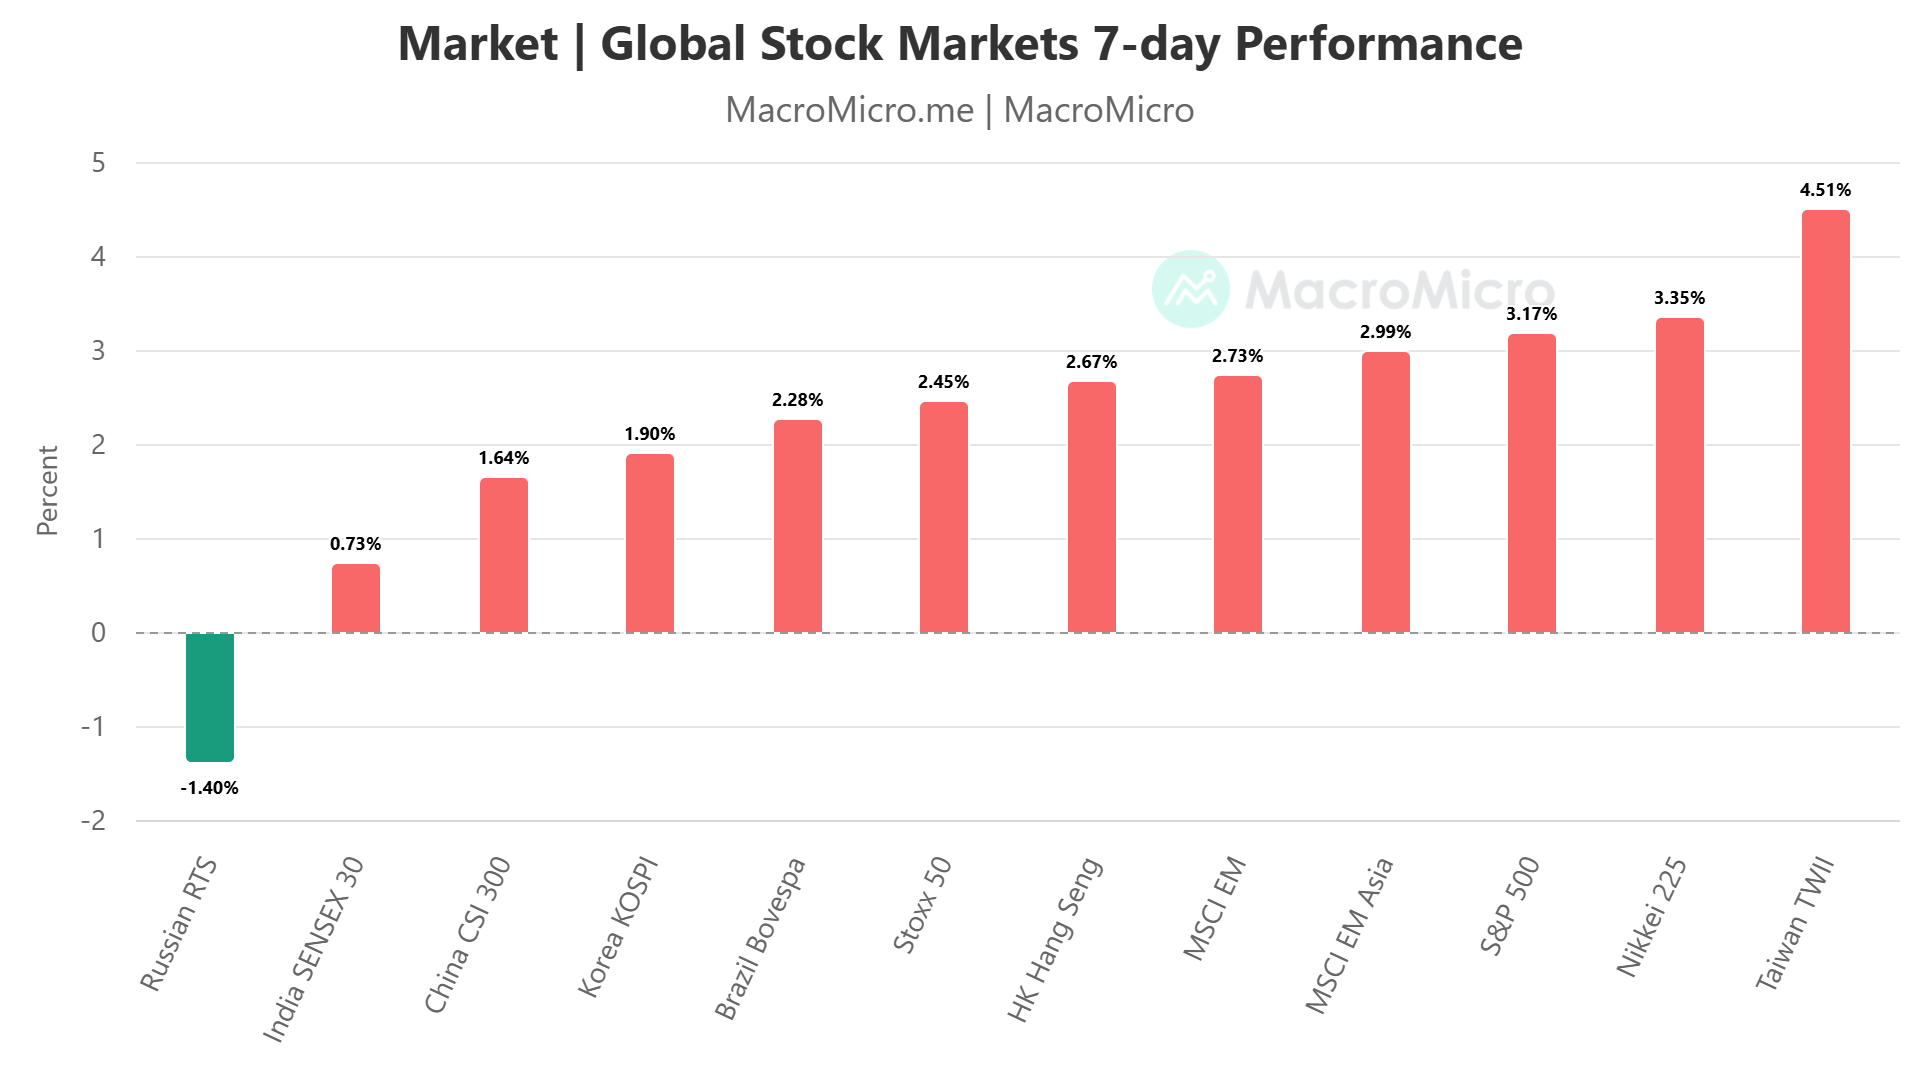
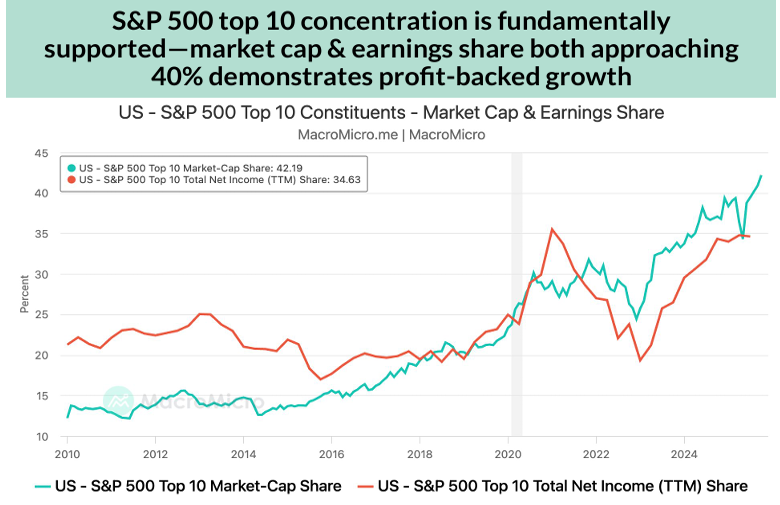
Chart of the week: S&P500 Earnings and Market Cap Concentration
The top 10 U.S. companies now drive over 40% of S&P 500 performance, supported by fundamentals: their share of total profits has risen from ~20% pre-pandemic to nearly 40%. With extensive M&A and strong operations, their market-cap dominance aligns with genuine earnings growth, not valuation excess.
Exhibit 2: S&P 500 Earnings and Market Cap Concentration
Market Summary Table
| Name | Week Close | Week Change | Week High | Week Low |
|---|---|---|---|---|
| Cash Rate% | 3.60% | |||
| 3m BBSW % | 3.67 | 0.03 | 3.67 | 3.66 |
| Aust 3y Bond %* | 3.89 | 0.13 | 3.88 | 3.74 |
| Aust 10y Bond %* | 4.53 | 0.06 | 4.53 | 4.43 |
| Aust 30y Bond %* | 5.12 | 0.02 | 5.11 | 5.06 |
| US 2y Bond % | 3.50 | -0.04 | 3.51 | 3.46 |
| US 10y Bond % | 4.01 | -0.07 | 4.06 | 4.00 |
| US 30y Bond % | 4.65 | -0.07 | 4.72 | 4.64 |
| $1AUD/US¢ | 65.24 | 0.75 | 65.35 | 64.45 |
Global Themes Shaping Markets
AI Bubble
Global equity markets softened in November after hitting record highs in October, with major U.S. indices retreating across the board. The Dow Jones fell 0.3%, the Nasdaq 2.2%, the S&P 500 0.4%, and the semiconductor-heavy SOX dropped 4.6%. The correction in tech spilled over into Asia’s technology-oriented markets, where South Korea’s KOSPI lost 2.6%, Japan’s Nikkei declined 5.4%, and Taiwan’s TAIEX slipped 2.9%. In contrast, Southeast Asia posted notably stronger results: India rose 2.0% to a fresh all-time high, and Indonesia outperformed globally with a 5.4% gain. Meanwhile, precious metals strengthened, with gold futures rallying 5.0% as expectations of a December rate cut increased.
Two topics dominated market debate this month, concerns over an AI bubble and rising liquidity risks. However, neither issue has reached a critical turning point, and the market’s most decisive phase lies ahead. On the AI front, froth is visible but far from systemically dangerous. The current productivity cycle suggests that some “bubble-like” behaviour is constructive; significant corporate investment in AI infrastructure is fuelling what MacroMicro describes as an “AI perpetual motion machine.”
Corporate earnings and activity continue to validate this trend. Tech giants’ Q3 results and forward guidance broadly exceeded expectations, with particularly strong momentum in cloud, advertising, and hardware segments. The Citi Earnings Revision Index remains on an upward trajectory. The semiconductor cycle also shows no signs of reversal, year-on-year growth stands at 25%, and sector revenues are hitting new highs. The Manufacturing Cycle Index tracked by MacroMicro has returned to expansionary territory, and recession probability estimates have eased to around 30%.
Over the medium term, the financial health of leading AI companies, including record free-cash-flow levels and low leverage, indicates a far more robust backdrop than the dot-com era. However, the report stresses that Q2 2026 will be a pivotal period for reassessment. A high earnings base will naturally weigh on growth rates, while inventory trends could become a key pressure point. NVIDIA’s days of inventory have begun rising, led mainly by increases in work-in-process.
For now, this likely reflects pre-emptive manufacturing amid strong demand. But the critical signal will emerge once work-in-process converts into finished goods. If inventory days fall, it will confirm healthy end-demand; if they remain elevated, bubble concerns will re-intensify.
The narrative around AI is also shifting from bubble risk to competitive dynamics, particularly among cloud providers and ecosystem players such as Google and OpenAI.
Liquidity Concerns? Why Fears Are Premature and December Cuts Remain a Secondary Issue
Liquidity worries have resurfaced in global markets, but current signals do not point to imminent stress. The narrative has unfolded in three stages: a widening spread between the Secured Overnight Financing Rate (SOFR) and the Interest on Reserve Balances (IORB), remarks from several hawkish FOMC members suggesting a December rate cut is not guaranteed, and a delayed September non-farm payroll report showing a solid +110k jobs, after which markets reverted to interpreting good economic news as bad for policy outlook. However, we argue none of these developments warrant genuine concern at this stage.
The SOFR–IORB spread narrowing and bank reserves slipping below the US$3 trillion threshold do represent early warning signs of tighter liquidity, but the Federal Reserve is already preparing the appropriate response. Consistent with guidance provided in earlier months, the Fed appears ready to pause quantitative tightening (QT) in December. November should therefore be viewed as a transitional period with liquidity set to improve once QT is halted. Because the pause is widely anticipated, liquidity stress is unlikely to escalate meaningfully in the near term.
Market anxiety over whether the Fed cuts in December is similarly overstated. The specific month of the first cut is less important than the endpoint of the easing cycle. Fed officials have explicitly stated that a skip in December would reflect a desire to incorporate October CPI and labour data, released after the meeting, rather than a shift toward tighter policy. Cutting next month would simply bring forward easing marginally; not cutting would preserve flexibility.
The market’s reaction to the delayed payroll report, treating positive data as negative, is also viewed as largely irrelevant. What matters for markets is recession risk, not one-off labour print distortions.
A further important signal is coming from the Japanese yen. Despite Prime Minister Takaichi’s ¥21.3 trillion fiscal package and a rally in both Japanese equities and JGB yields, the yen weakened significantly. This suggests markets are not responding to yield differentials or repatriation flows; instead, investors are increasingly concerned about rising debt levels and large-scale liquidity injections. The fact that both the US dollar and Yen remain soft indicates that capital has not meaningfully rotated back into traditional safe-haven assets. This reinforces that global liquidity remains ample, and fears of systemic tightening are premature.
Global Equity Valuations
Global equity valuations were broadly stable to slightly lower between October and November 2025. The USA remained the most expensive market with a PE of 27.52, down from 29.12. Germany, UK, and Australia showed mild declines, while Australia stayed relatively elevated at 20.34. Japan eased to 18.10, and China slipped to 15.10. Brazil remained the cheapest major market at 10.74, despite rising from September. South Korea (16.15) and Thailand (16.11) softened, while Taiwan held a high valuation at 21.69. Overall, valuations indicate continued premium pricing for U.S. and Asian tech-heavy markets.
Overview of the US Equities Market
US equities rallied to close out November, overcoming both midmonth volatility and a rare CME outage that temporarily disrupted futures trading. A combination of thin post-holiday volume, optimism around imminent Federal Reserve rate cuts and improving risk sentiment helped push major indices back toward record territory. The S&P 500 rose 0.5% in Friday’s shortened session, bringing it within reach of its late-October high and securing a seven-month winning streak, the longest since 2018. The Dow advanced 0.6%, while the Nasdaq 100 gained 0.8%, though the tech-heavy benchmark still recorded its first monthly decline since March as investors rotated out of stretched AI winners and into defensive sectors.
Markets initially wavered as a cooling-system failure in a Chicago-area data centre forced the Chicago Mercantile Exchange to halt futures trading across key equity, bond and commodity contracts. The disruption lasted longer than a similar 2019 outage, pausing activity in Treasury futures, equity index derivatives, gold and oil contracts. Despite this, spot markets absorbed most of the liquidity, FX trading continued uninterrupted, and broader market sentiment remained upbeat. Traders noted that although some participants used the outage to exploit pricing discrepancies, most adopted a cautious pause until systems returned online.
The rally reflected renewed expectations that the Federal Reserve may accelerate monetary easing. Money markets were pricing in an 80% probability of a December rate cut before the CME halt, buoyed by softer labour indicators and a string of subdued economic releases consistent with a “soft landing.” Analysts warned, however, that the absence of key US data in recent months leaves room for negative surprises. The upcoming Challenger job cuts report, ADP payrolls, and the Fed’s preferred inflation gauge are likely to drive early-December positioning.
Earlier weakness in November stemmed from mounting concerns over inflated valuations in the artificial-intelligence sector. The Nasdaq 100 had been down as much as 4.7% for the month before rebounding. Defensive sectors such as healthcare benefited from rotation, while AI-linked megacaps faced pressure. Yet Friday saw renewed strength in tech, with Intel, Amazon and other large caps outperforming. Walmart hit a record as Black Friday spending expectations strengthened retail momentum.
Global equity markets were calm amid light liquidity. Europe’s Stoxx 600 rose 0.2%, and Asian equities edged lower after a brief multi-day rally. In fixed income, 10-year Treasury yields ticked up three basis points to 4.02% but remained near one-month lows; the dollar held steady following earlier weakness.
Commodity markets experienced a volatile session, particularly in gold, where the CME outage briefly disrupted futures and options activity. Once trading resumed, spot gold climbed 1.4% toward US$4,217/oz. Strategists highlighted continued central bank buying, expectations of Fed cuts, concerns about US debt, and a weakening dollar as key bullish drivers. Oil prices staged a modest rebound but remained on track for a fourth monthly decline as traders awaited the OPEC+ meeting and monitored geopolitical developments, including potential Ukraine peace negotiations.
Overall, despite a disruptive technical glitch and lingering macro uncertainty, markets ended the week in a stronger position, helped by lower yields, resilient risk appetite and hopes that the Fed’s “unfinished business of rate cuts” will support asset prices into year-end.
Overview of the US Treasuries Market and Other Fixed Income Markets
A four-day rally in U.S. Treasuries paused on Wednesday after unexpectedly strong labour-market data tempered expectations of aggressive Federal Reserve easing. The 10-year Treasury yield held at 4%, steady after touching a one-month low the previous day, while yields across the curve inched higher, led by the two-year note, the maturity most sensitive to interest-rate expectations. The move came after weekly jobless claims fell sharply to 216,000, the lowest level since mid-April and well below forecasts of 225,000, signalling persistent labour-market resilience despite broader signs of economic cooling.
The stronger-than-expected labour report complicated the recent bond rally, which had been supported by delayed September employment data, softening indicators, and dovish commentary from Federal Reserve officials. Traders have increasingly priced in an 80% chance of a 25-basis-point Fed rate cut in December, up significantly from the prior week. Expectations were further boosted by New York Fed President John Williams’ remarks that there is scope for “near-term” easing and by reports that National Economic Council Director Kevin Hassett, viewed as dovish, is the frontrunner to replace Jerome Powell as Fed chair in 2026.
Despite this, some strategists caution that markets may be over-pricing cuts given that inflation remains above target and producer-price inflation, based on delayed September PPI data, came in hotter than expected. Societe Generale strategist Mathias Kpade warned that if inflation proves sticky or if economic activity rebounds modestly, markets could face a “hawkish surprise,” arguing investors should position for fewer cuts. Charles Schwab’s Kathy Jones echoed that December’s decision remains finely balanced, particularly with key CPI and payrolls data postponed until later in December due to the government shutdown.
Treasury market moves were moderate, partly because trading volumes were thin ahead of the Thanksgiving holiday. A $44 billion auction of seven-year notes cleared at a yield slightly above pre-auction levels, reflecting cautious demand. Meanwhile, attention shifted to the U.K., where gilts rallied amid signs of more disciplined government borrowing.
The broader Treasury rally earlier in the week reflected a shift in market psychology. Investors had responded positively to signs of labour-market cooling, growing political momentum for a more dovish Fed leadership, and expectations that the central bank must act soon to support a soft landing. Yet the unexpected drop in jobless claims injected fresh uncertainty, raising questions about whether the economy is slowing enough for the Fed to ease without reigniting inflation pressures.
With a “data vacuum” until mid-December, traders are left navigating mixed signals: softer long-term trends favour easing, but near-term indicators such as jobless claims and wholesale-inflation readings pose risks. As a result, while a December cut remains the consensus, conviction is fragile—and any surprise in upcoming data could significantly reshape the policy outlook.
Figure 3: Bond Yield Movements in the Past Week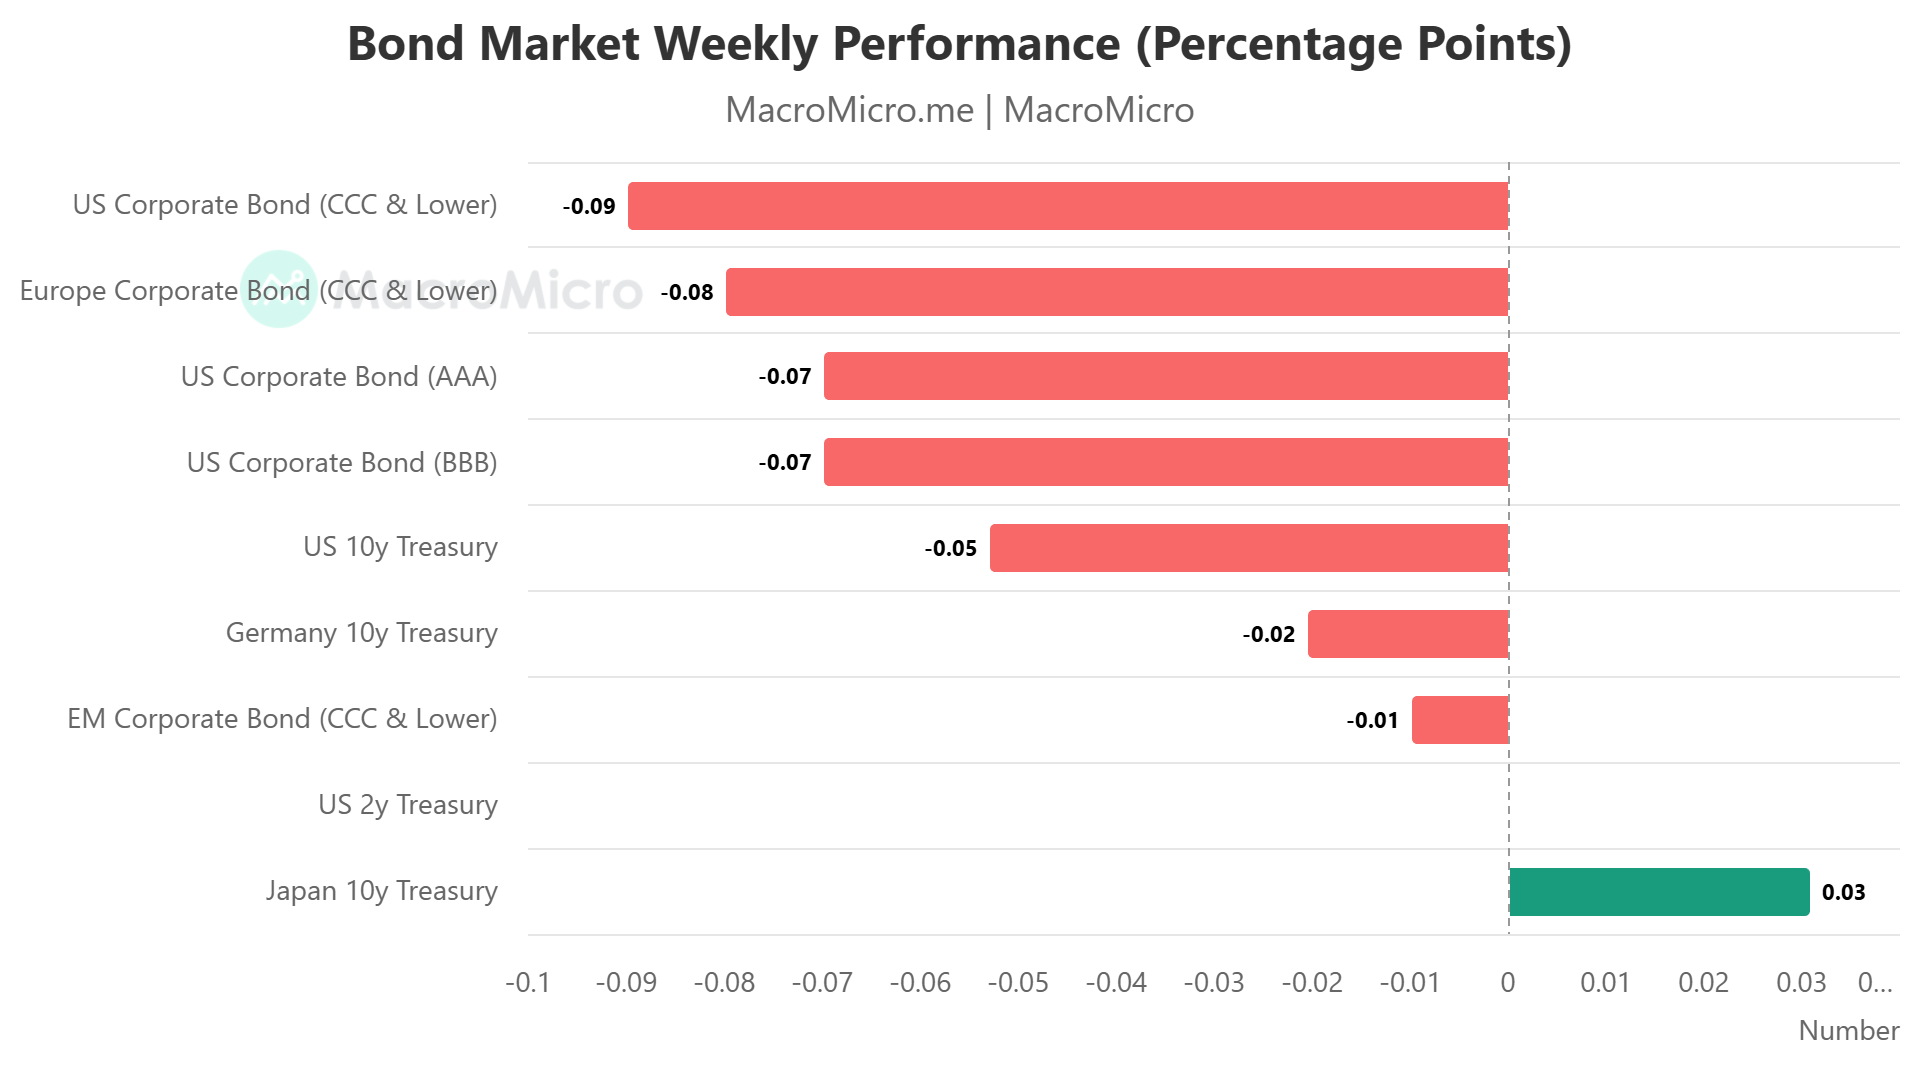
Overview of the Australian Equities Market
Australian equities broke a four-week losing streak, delivering their strongest weekly performance since May despite a muted finish on Friday. The S&P/ASX 200 slipped 3.2 points (-0.04%) to 8,614.1 in a subdued session influenced by a U.S. bank holiday, while the All Ordinaries rose 0.08% to 8,918.7. The week’s rebound was driven largely by improving global sentiment, as markets increasingly priced in the likelihood of a U.S. Federal Reserve rate cut, lifting global equities and risk appetite.
Sector performance was broadly positive, with eight of eleven sectors finishing higher. Consumer staples, technology, and utilities led gains. Woolworths jumped 3.2% after an upgrade from JP Morgan, while Endeavour Group climbed nearly 2%. The tech sector surged more than 6% for the week, its best performance in monthsas dip-buyers returned alongside strength in the Nasdaq. Utilities also benefited from defensive positioning.
Financials declined 0.7% on Friday as all major banks dipped, though the sector still ended the week modestly higher (+0.2%), snapping a two-week losing streak. Raw materials posted one of the strongest weekly sector gains, rising over 5%, supported by firmer commodity sentiment earlier in the week. However, China’s continued property-sector concerns pressured iron ore futures on Friday, pulling BHP and Rio Tinto slightly lower for the day. Both miners remained up more than 3% across the five sessions.
Gold equities continued to shine, buoyed by stronger expectations of U.S. rate cuts and a surge in spot gold to US$4,184/oz (A$6,406). VanEck’s Goldminers ETF rose more than 10% to reach five-week highs. Energy stocks were marginally weaker amid competing signals, concerns over global oversupply versus hopes for geopolitical de-escalation in key conflict regions.
The Australian dollar traded at US$0.6529, near two-week highs, supported by shifting U.S. rate expectations. Across the region, the NZX 50 gained 0.42%, while Japan’s Nikkei added 0.17%. Notable ASX 300 companies holding AGMs included Centuria Capital Group, IperionX, and Myer Holdings.
Figure 4– World MSCIPE Ratio by country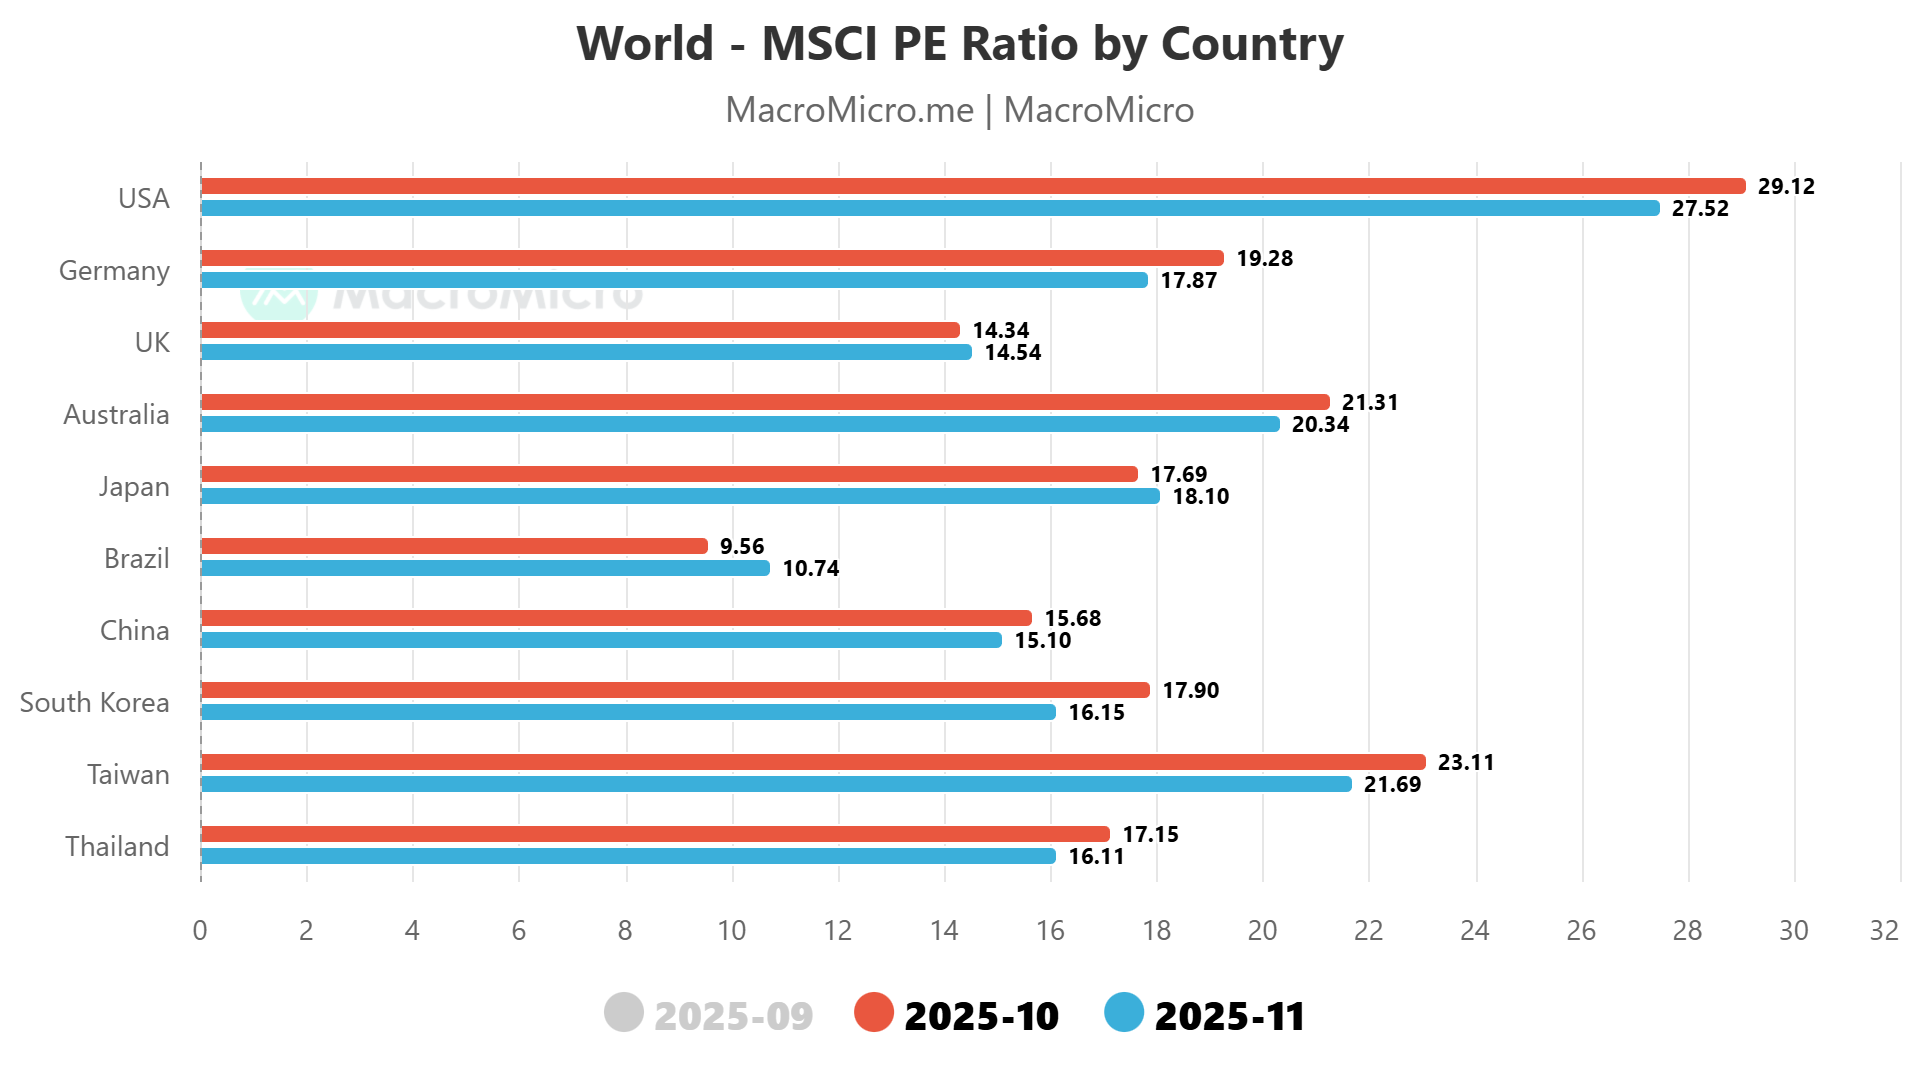
Overview of the Australian Government Bond Market
The ABS’s shift from quarterly to full monthly CPI reporting marks a major improvement in Australia’s inflation monitoring, enabling earlier detection of price pressures. The October release showed headline CPI rising 3.8% year-on-year and trimmed-mean inflation at 3.3%, both slightly above the RBA’s forecasts of 3.7% and 3.2%. The data confirmed that inflationary momentum remains stronger and more persistent than policymakers had hoped.
Several forces are driving the renewed inflation surge. Seasonal timing played an outsized role this year, with school holidays concentrated in October, pushing domestic travel prices up 6% in the month and more than 7% on an annual basis. Utilities and water costs also accelerated, with water bills up 4% in October and 7% year-on-year—introducing a fresh pressure point not present during the 2022 inflation spike. Imported goods inflation re-emerged, with typically stable categories such as clothing, footwear and homewares rising 2–3%. Housing-related costs increased modestly, with new dwelling prices up 0.4%. Meanwhile, the removal of electricity subsidies continues to distort the data, with electricity prices now 37% higher than a year ago.
The implications are significant. For inflation to fall sustainably toward the RBA’s 2–3% target, services inflation would need to slow to around 3–4% and goods inflation to near zero. Yet many services—health, education, childcare, utilities—remain above 4%. While some pressures may ease in 2025, a key risk is the wage-inflation feedback loop, particularly with the June minimum wage decision looming. Markets have already reacted: three-year government bond yields have risen above 3.85%, and expectations of first-half 2026 rate cuts have been largely priced out, with markets assigning roughly a 50% probability of a rate hike by year-end.
The shift to monthly CPI increases the likelihood of more reactive policy and market moves. Broad-based cost pressures suggest the cost-of-living squeeze will linger, and interest-rate-sensitive assets may face further volatility. Ultimately, the Q4 inflation print due in late January will be pivotal; a trimmed-mean reading near 1% could challenge the RBA’s policy stance and extend the inflation fight.
Global bond markets saw a mixed performance over the week, with Australian yields rising notably while U.S. yields edged lower. The RBA cash rate remained unchanged at 3.60%, but short-term funding costs in Australia continued to firm. The 3-month BBSW increased 3 bps to 3.67%, reflecting ongoing repricing of front-end interest-rate expectations.
Australian government bond yields moved higher across the curve, driven by the stronger-than-expected inflation outlook and reduced expectations of early-2026 rate cuts. The Australian 3-year yield rose sharply by 13 bps to 3.89%, reaching a weekly high of 3.88% and signalling market concerns around sticky domestic inflation. Longer-dated yields also increased, though more modestly: the 10-year yield climbed 6 bps to 4.53%, while the 30-year yield inched up 2 bps to 5.12%. These moves suggest a mild bear-steepening as markets reassess duration risk and the RBA’s policy path.
In contrast, U.S. Treasury yields drifted lower as softer inflation signals and moderating labour-market indicators supported expectations of further easing by the Federal Reserve in 2026. The 2-year Treasury yield fell 4 bps to 3.50%, while the 10-year declined 7 bps to 4.01%, touching a weekly low of 4.00%. The 30-year yield also eased 7 bps to 4.65%, indicating broad-based buying across the U.S. curve.
In currency markets, the Australian dollar strengthened, rising 0.75 cents to USD 0.6524. The move was supported by firmer domestic yields and a softer U.S. dollar backdrop as markets continued to price a gradual Fed easing cycle.
Overall, the week reflected diverging macro signals: domestic inflation concerns pushed Australian yields higher, while U.S. data continued to support a soft-landing and modest downward pressure on Treasury yields.
Looking Ahead: Major Economic Releases for the Week Ending 5th December
For the week ending December 5, 2025, Australian economic data will be in the spotlight, with S&P Global Manufacturing PMI Final for November expected to reflect continued modest expansion, indicating resilient industrial activity amid global headwinds. Building Approvals and Total YY for October are anticipated to show a rebound, suggesting stabilization in the housing sector despite rate pressures. Current Account Balance SA and Net Exports Contribution for Q3 may point to a widening deficit offset by positive export contributions, while S&P Global Services and Composite PMI Finals for November could confirm service sector strength. Real GDP QQ SA and YY SA for Q3 are projected to reflect moderate growth pickup from prior softness. Trade data, including Balance on Goods, Goods/Services Imports, and Exports for October, may highlight a robust surplus driven by export recovery.
In the United States, economic data releases for October and November face ongoing delays due to the aftermath of the longest government shutdown in history, affecting collection and processing at key agencies. S&P Global Manufacturing PMI Final and ISM Manufacturing PMI for November may indicate marginal improvement but persistent contraction in the sector. Import Prices YY and Industrial Production MM for September could show emerging price pressures and slight output declines, while S&P Global Composite and Services PMI Finals along with ISM Non-Manufacturing PMI for November are expected to confirm expansion in services. Initial Jobless Claims for the week of November 29 might edge higher, signaling minor labor market softening. Delayed reports, including New Home Sales-Units for September and International Trade for September, could eventually reveal subdued housing and widening trade deficits. These indicators might affirm the Federal Reserve’s easing bias to sustain growth amid cooling inflation, but lingering delays could heighten market volatility and complicate policy assessments. Global trade uncertainties, including U.S. tariff policies, may continue to pose risks to both economies.
Major Economic Releases for the Week ending 5 Dec, 2025
| Date | Country | Release | Consensus | Prior |
|---|---|---|---|---|
| Monday, 01/12 | United States | S&P Global Mfg PMI Final | n/a | 51.9 |
| Monday, 01/12 | United States | ISM Manufacturing PMI | 49 | 48.7 |
| Tuesday, 02/12 | Australia | Building Approvals | n/a | 12 |
| Tuesday, 02/12 | Australia | Building Approval Total YY | n/a | 12.4 |
| Tuesday, 02/12 | Australia | Current Account Balance SA | n/a | -13.7 |
| Tuesday, 02/12 | Australia | Net Exports Contribution | n/a | 0.1 |
| Tuesday, 02/12 | Australia | S&P Global Svs PMI Final | n/a | 52.7 |
| Tuesday, 02/12 | Australia | S&P Global Comp PMI Final | n/a | 52.6 |
| Wednesday, 03/12 | Australia | Real GDP QQ SA | n/a | 0.6 |
| Wednesday, 03/12 | Australia | Real GDP YY SA | n/a | 1.8 |
| Wednesday, 03/12 | United States | Import Prices YY | n/a | 0 |
| Wednesday, 03/12 | United States | Industrial Production MM | 0 | 0.1 |
| Wednesday, 03/12 | United States | S&P Global Comp PMI Final | n/a | 54.8 |
| Wednesday, 03/12 | United States | S&P Global Svcs PMI Final | n/a | 55 |
| Wednesday, 03/12 | United States | ISM N-Mfg PMI | 52.1 | 52.4 |
| Thursday, 04/12 | Australia | Balance on Goods | n/a | 3938 |
| Thursday, 04/12 | Australia | Goods/Services Imports | n/a | 1.1 |
| Thursday, 04/12 | Australia | Goods/Services Exports | n/a | 7.9 |
| Thursday, 04/12 | United States | Initial Jobless Clm | 220 | 216 |
Source: Refinitiv
For more detailed weekly updates, YieldReport Weekly