Summary:
The ABS’s shift from quarterly to full monthly CPI reporting marks a major improvement in Australia’s inflation monitoring, enabling earlier detection of price pressures. The October release showed headline CPI rising 3.8% year-on-year and trimmed-mean inflation at 3.3%, both slightly above the RBA’s forecasts of 3.7% and 3.2%. The data confirmed that inflationary momentum remains stronger and more persistent than policymakers had hoped.
Several forces are driving the renewed inflation surge. Seasonal timing played an outsized role this year, with school holidays concentrated in October, pushing domestic travel prices up 6% in the month and more than 7% on an annual basis. Utilities and water costs also accelerated, with water bills up 4% in October and 7% year-on-year—introducing a fresh pressure point not present during the 2022 inflation spike. Imported goods inflation re-emerged, with typically stable categories such as clothing, footwear and homewares rising 2–3%. Housing-related costs increased modestly, with new dwelling prices up 0.4%. Meanwhile, the removal of electricity subsidies continues to distort the data, with electricity prices now 37% higher than a year ago.
The implications are significant. For inflation to fall sustainably toward the RBA’s 2–3% target, services inflation would need to slow to around 3–4% and goods inflation to near zero. Yet many services, health, education, childcare, utilities, remain above 4%. While some pressures may ease in 2025, a key risk is the wage-inflation feedback loop, particularly with the June minimum wage decision looming. Markets have already reacted: three-year government bond yields have risen above 3.85%, and expectations of first-half 2026 rate cuts have been largely priced out, with markets assigning roughly a 50% probability of a rate hike by year-end.
The shift to monthly CPI increases the likelihood of more reactive policy and market moves. Broad-based cost pressures suggest the cost-of-living squeeze will linger, and interest-rate-sensitive assets may face further volatility. Ultimately, the Q4 inflation print due in late January will be pivotal; a trimmed-mean reading near 1% could challenge the RBA’s policy stance and extend the inflation fight.
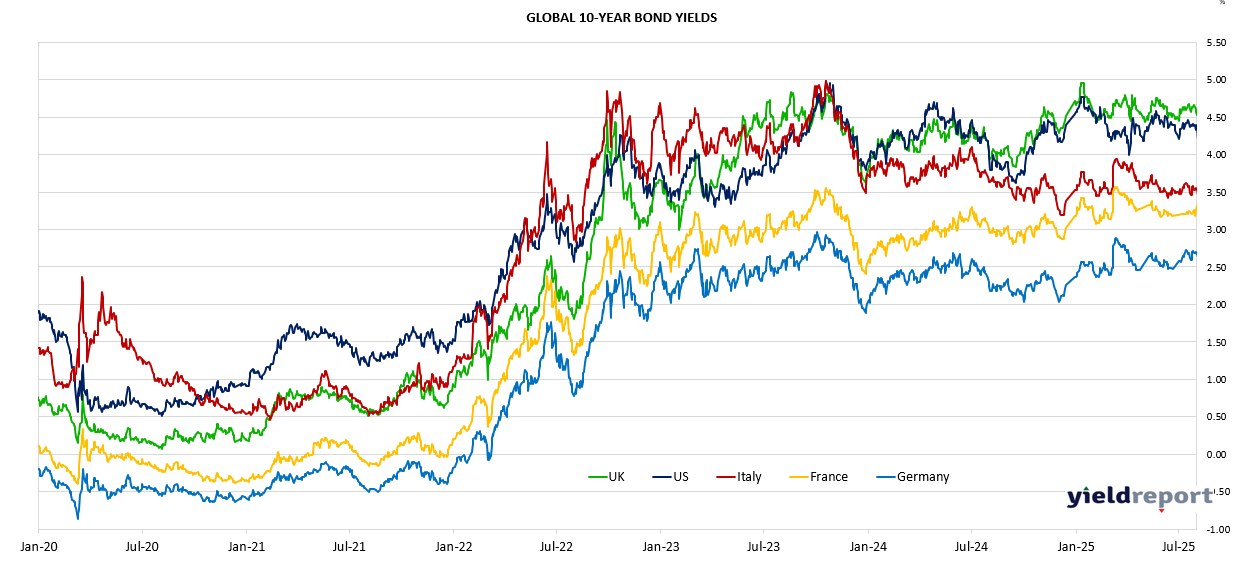
Global bond markets saw a mixed performance over the week, with Australian yields rising notably while U.S. yields edged lower. The RBA cash rate remained unchanged at 3.60%, but short-term funding costs in Australia continued to firm. The 3-month BBSW increased 3 bps to 3.67%, reflecting ongoing repricing of front-end interest-rate expectations.
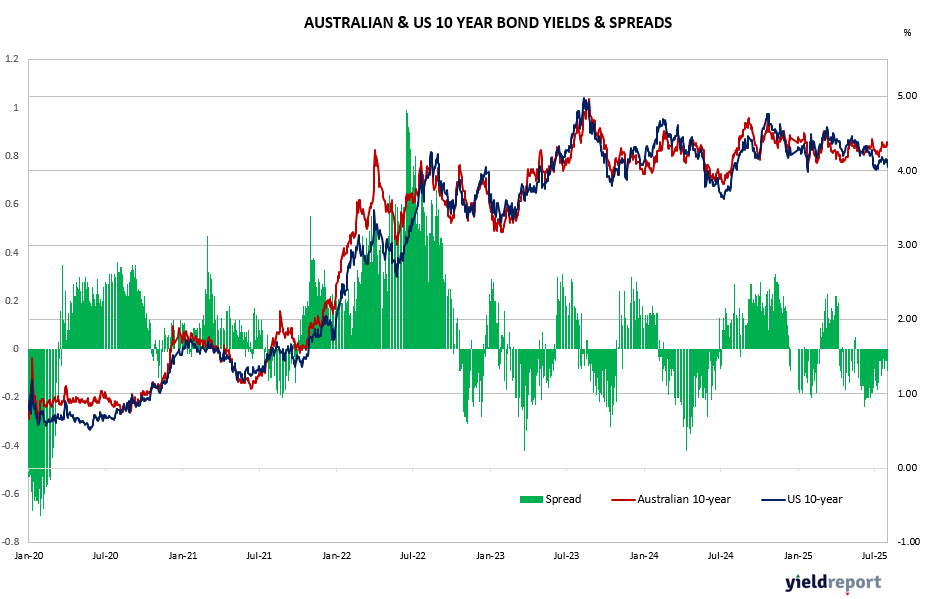
Australian government bond yields moved higher across the curve, driven by the stronger-than-expected inflation outlook and reduced expectations of early-2026 rate cuts. The Australian 3-year yield rose sharply by 13 bps to 3.89%, reaching a weekly high of 3.88% and signalling market concerns around sticky domestic inflation. Longer-dated yields also increased, though more modestly: the 10-year yield climbed 6 bps to 4.53%, while the 30-year yield inched up 2 bps to 5.12%. These moves suggest a mild bear-steepening as markets reassess duration risk and the RBA’s policy path.
In contrast, U.S. Treasury yields drifted lower as softer inflation signals and moderating labour-market indicators supported expectations of further easing by the Federal Reserve in 2026. The 2-year Treasury yield fell 4 bps to 3.50%, while the 10-year declined 7 bps to 4.01%, touching a weekly low of 4.00%. The 30-year yield also eased 7 bps to 4.65%, indicating broad-based buying across the U.S. curve.
In rates markets, Australian bonds traded in narrow ranges. The cash rate remained at 3.60%, while short-dated funding indicators such as the 3-month BBSW held steady at 3.64%, reflecting stable liquidity conditions. Across the sovereign curve, yields drifted slightly higher: the 3-year bond closed at 3.76%, the 10-year at 4.47% (+3bps) and the 30-year at 5.10% (+7bps), indicating mild curve steepening amid reassessed long-run inflation expectations.
Figure 1: Aust. 3 yr minus 10 yr Bond Spread
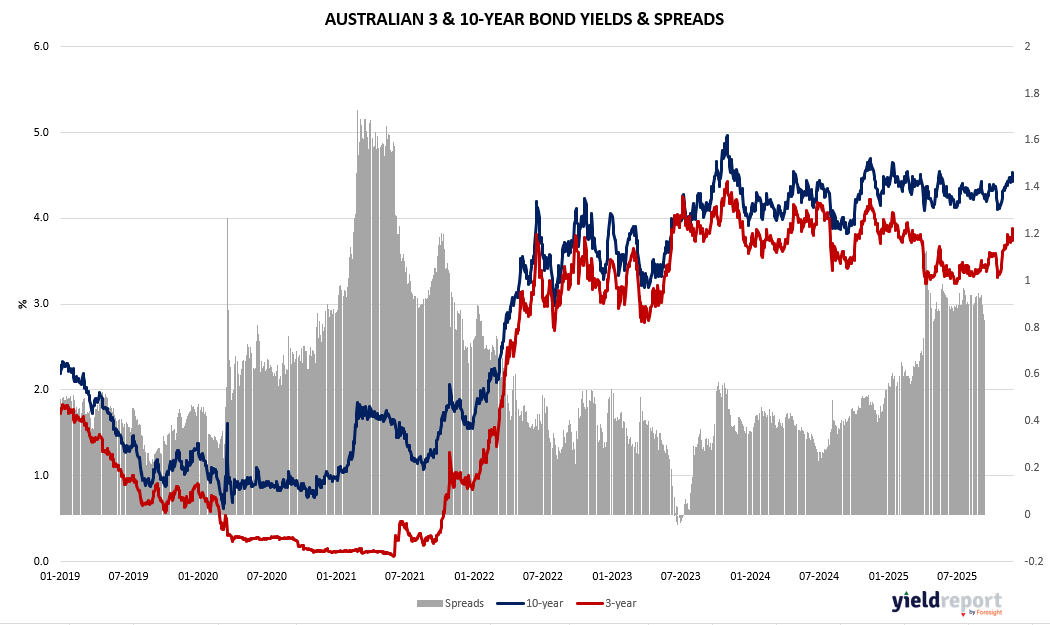
Figure 2: Australian & US Bond Yields